I’d like to share a simple technique I’ve deployed to help trap movement across many different types of projects. I’ve used this simple table to measure the speed of movement in sales pipelines, recruitment projects and acquisition strategies. You can think of many more I’m sure.
The issue with project management isn’t so much what’s been achieved at the end of a week (although that’s clearly important) but it’s more about what’s changed since the last meeting. What’s the delta since last Monday when we met? What have you personally done in the last 5 days, 5 weeks, 5 months to move the ball down the field?
Profit and loss accounts (P&Ls) and cash flows are delta statements. They are changes between one balance sheet in time and the next balance sheet snapshot taken at a later date. P&Ls measure velocity. Cash Flows measure velocity.
The Velocity Table
Case Study 1 – Sales Process
Let’s imagine your sales process has four distinct phases before a Purchase Order can be expected to arrive. Discovery – early discussions with suspects where the quality will be all over the map. Diagnosis stage – deeper conversations with people who might buy your stuff. Design stage – really important discussions where you are working closely with the sales lead to develop the most appropriate solution to solve a well funded, priority project. Delivery – a stage which starts with the arrival of a PO and ends with a happy operational customer.
This is how the table would work: (Note yellow boxes and end columns are driven by formula)
Case Study 2 – Recruitment Project
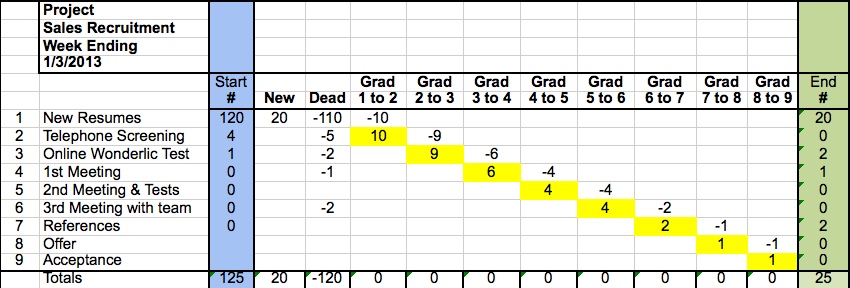
In this example, let’s assume you are hiring 5 more sales professionals. You will have a collection of steps prior to job offers to the successful candidates. The stages might include: telephone screening, Myers-Briggs or Wonderlic personality/cognitive type tests, face to face interviews, second round interviews and testing, third round team meetings and presentations, reference checking, final negotiations and offer.
This is how the table might work:
Case Study 3 – Acquisitions
Acquisition success like any great project requires a process. It requires a rigorous set of steps that take targets out of contention quickly. An acquisition process becomes really expensive when you take every target company all the way through to due diligence and then decide not to buy the company. You want to get to No as quickly as possible. The stages I believe work best are as follows: based on a rigorous acquisition profile you build an initial list of priority targets (these could come from primary research as well as advisors), based on initial research you build a shortlist of relevant targets worth contacting, some targets agree to a meeting, some targets are worth a second meeting, one or more targets are researched in detail, a post acquisition strategy is built on an elite list, a board mandate is requested with a justifiable business case, meet with one or more targets to negotiate a deal, execute due diligence, negotiate legal agreement, close a deal.
The table would look like this:
This technique is a great way to measure movement in projects where volume of throughput is important. Of course if the table reflects no movement then this is not necessarily a bad thing. It just begs further investigation. Equally a table with aggressive movements might imply the project manager is rushing things too hastily, leading to mistakes.
Like the way we think? You’ll love the way we work.


