Kelley Blue Book for second hand companies doesn’t exist but hopefully this post will explain how a buyer thinks when valuing acquisition targets.
Basically you need to establish some key facts and understand the basic formulas used, recognizing that each sector will have their favorite methods. Academics will tell you there are at least 6 ways of valuing businesses; the Price Earnings (PE) Ratio, Return on Investment (ROI), Multiple of Sales, Multiple of Gross Margin, Net Assets of the balance sheet, and Discounted Sustainable Cash Flows of the target.
In reality most buyers of private companies will lean heavily on two, the PE Ratio and/or a Multiple of Sales. Once valued the acquirer will compare the value with net assets being acquired and the difference is technically and emotionally called goodwill. Forecasting cash generation 10 years out into the future and discounting those back to today is too unreliable for most acquirers. However cash flow plays a big part in how VCs assess an investment opportunity but that is dealt with here.
So the obvious question to ask, what multiple, what PE to use and what is the definition of profit.
What Profit Multiplier to Use?
You need to gather some key PE ratios and then apply a little experience.
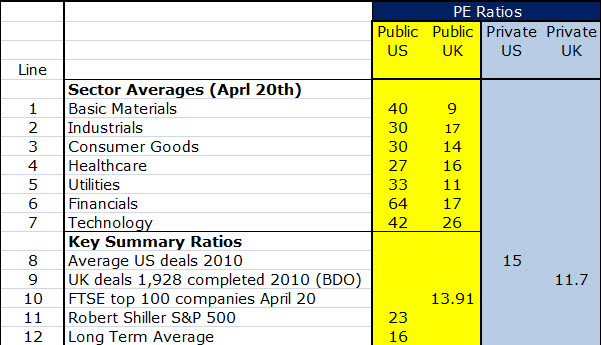
These ratios come from various sources: Lines 1 to 7 are extracted from Y Charts data on 4739 US public companies from a market worth of $435Bn to as small as $450,000! Find your specific sector by clicking the Y Chart data table. The UK column is based on the FTSE Actuaries Share Indices table. Remember these are averages and individual companies within these sectors could have wildly different PE ratios to these. Line 8 is an assumption for the purpose of this example but more importantly using Acquisitions Monthly or equivalent database it is possible to analyze deals completed in your sector and some will disclose sufficient information to get a comparable PE ratio. Line 9 is an actual average from BDO’s index tracked in the UK. Line 10 is the average PE ratio for the top UK companies on that day. Line 11 is the Robert Shiller (Yale professor) PE index of the S&P 500 based on the average profits over the last 10 years and he often compares that with the long term average PE, line 12. These are the types of ratios you need to assemble to come up with a fair multiple that an acquirer might apply to an established target company.
So let’s bring it together with an example, let’s say you were a medical instrument supplier, which is within the healthcare sector. The nearest competitor is Baxter with a PE of 23.68 (not shown). The sector average for medical products is 23 (not shown). Deals done in your sector are being done around a PE of 14. Assuming you have a significant market share and all major factors (see final heading below) are normal. Given these facts, in my view an acquirer will be assessing you at around a PE range of 12 to 14. The acquirer wants to avoid paying more than the sector averages of public companies and the acquirer’s own PE.
What Profit to Use?
Most acquirers want to understand the sustainable level of post tax profits from the target. The most common approach is to take the average of the previous 3 years audited profits pre tax, add the current years forecast and apply the acquirer’s full year tax charge. The profits making up the average will be “normalized” by adjusting for exceptional items. Examples include: costs associated with a major factory relocation, large exceptional bad debt write offs, large unusual long term bonuses or unreasonably high base salaries, daughter’s horse box expenses, Spanish sales office near the beach, adjustments required to be compliant with GAAP. Of course any adjustment adding to profits will be debated vigorously by the acquirer!
Valuation Range
Therefore assuming a sustainable post tax profit of say $3m is produced from the calculations and applying the PE range of 12 to 14 we arrive at a valuation range of $36m to $42m. if the balance sheet showed net assets of $10m, you would be valuing goodwill at a minimum of $26m.
The Sales Multiplier and Twitter
Of course some sectors have a very specific way of calculating value, based on the future potential of owing the target. In software the common basis is a multiple of sales. At present the overall average value of all US public software companies is around 2.68 times sales (Corum). However within that you have pure services businesses valued at 0.96 times sales. At the present time it is rumored that Twitter is being valued at 70 times 2011 estimated sales of $100m ie $7Bn. That valuation is beyond mere human valuation techniques.
Further Factors
Factors to bear in mind that will seriously impact the perception of value by the acquirer include:
- Dependence on a few customers
- Historical growth rates
- Quality of product pipeline
- IPR or lack of it
- Competence of second tier management
- Market share
- Minimum size, attractive valuations are difficult to achieve when sales are less than $10m.
- Sales pipeline
- Simple share structure
- One year of losses will require at least 2 great years of profits immediately after those losses
- Finally the logic above clearly doesn’t apply to loss making start ups acquired for their technology (and they are rare)
I hope that gives you some insights into the logic of valuation. Overall an acquirer perceives value and a seller aspires to price.
Share your experiences or feel free to clarify my logic.
Many thanks to Stonebridge Associates & LockeBridge for their kind input to this post.

