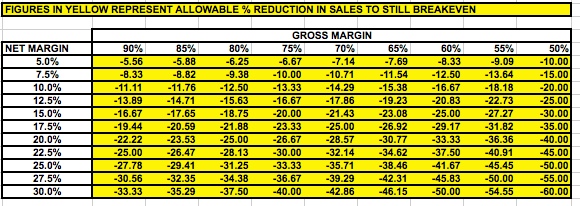
A little classic today you can do at home! Every business has a different set of economics but every business has one common element, they all have a break-even point. First establish your Gross Margin %. That would be your sales less your variable costs = Gross Margin, then divide that by sales, the Gross Margin %. Do the same for net margin, by taking your gross margin less all the fixed costs. Take this net margin divide it by sales, thus establish the Net Margin %. The find yourself on the table above. That tells you how far you can afford sales to drop before you lose money or bleed.
First identify your company on the table by your Gross Margin and your Net Margin (after fixed costs) e.g. say you make 80% Gross Margin and 15% Net Margin, on an annualized basis, your sales could drop 18.75% and you would still breakeven. Proof, Sales are say $50m, reduced to $40.62m, GM now $32.5m, FC were $32.5m, still breaking even. It basically shows you that in high fixed costs businesses you can’t afford to lose too many sales or of course you need to cut that breakeven-point down to size!
To ram home the point, take the top left hand corner of the table representing a high fixed cost business, Net Margin % of 5%, you can only lose 5.56% of your sales despite your high gross margin. Take the bottom right hand corner of the table representing a low fixed cost business, Net Margin % of 50%, you can afford to drop 60% .
I find it’s always useful to understand just how sensitive your business is to fluctuations in sales. This is especially true of software businesses where high operational gearing means that once you’ve set up your infrastructure you can really scale quickly and turn in some great margins.

